CCI Indicator Explained: A Complete Guide to the Commodity Channel Index
Oct 2, 2026
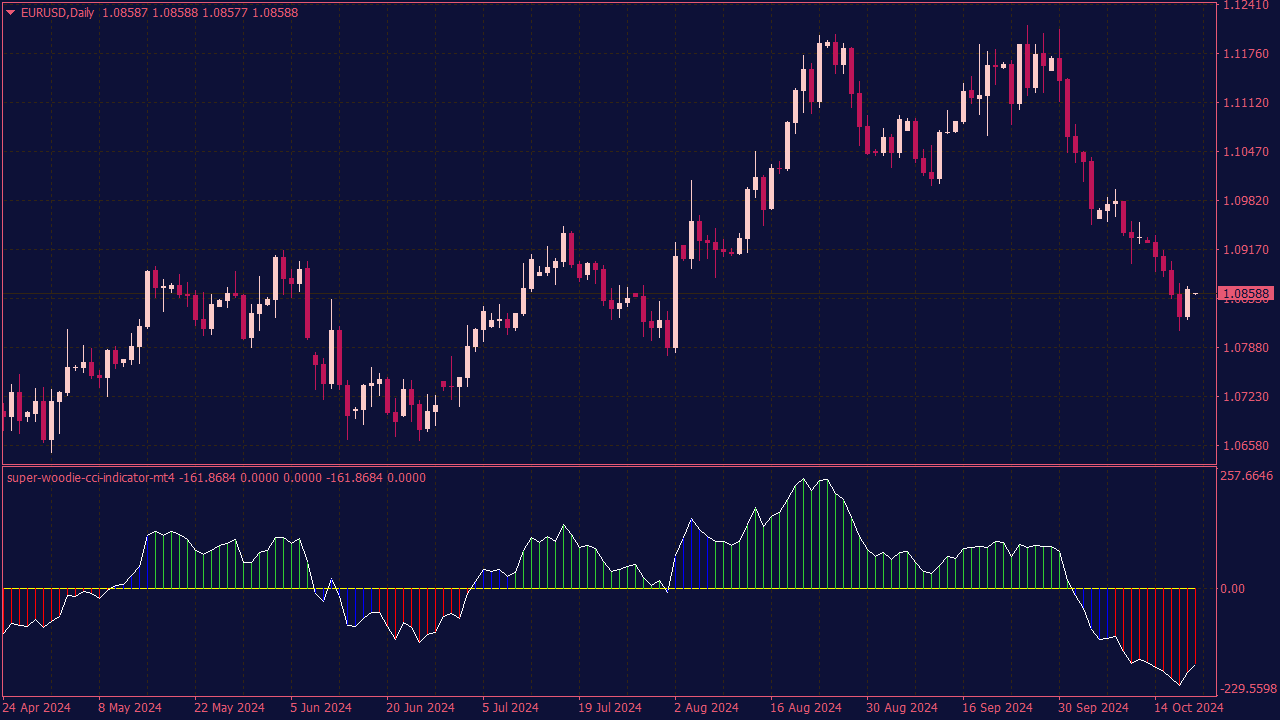
Learn what the CCI (Commodity Channel Index) is, how it is calculated, how to read overbought and oversold levels, zero line crosses and divergence, the best CCI settings for crypto, and how to set up an automatic CCI alert on TradingSignal.
The Commodity Channel Index (CCI) is one of the most versatile momentum indicators in technical analysis. Originally designed for commodity markets, it is now widely used by crypto traders to spot overbought and oversold conditions, catch the start of new trends and detect divergences before price reverses. In this guide, you will learn what the CCI indicator is, how it is calculated, how to read it, the best CCI settings for crypto, and how to automate it with a CCI alert.
What Is the CCI Indicator?
The Commodity Channel Index was developed by Donald Lambert and introduced in 1980. It measures how far the current price has moved away from its statistical average over a given period. When the CCI is high, price is trading well above its average; when it is low, price is trading well below it.
Unlike the RSI or the Stochastic RSI, the CCI is an unbounded oscillator: it fluctuates around a zero line with no fixed minimum or maximum. In practice, most readings fall between -100 and +100, and moves beyond those levels are considered unusually strong. This makes the CCI useful both as a mean-reversion tool and as a trend and breakout indicator.
How Is the CCI Calculated?
The CCI is built in four steps:
- Typical Price (TP): for each candle, TP = (High + Low + Close) / 3.
- Moving average of TP: a simple moving average of the Typical Price over the chosen length (20 periods by default).
- Mean Deviation: the average absolute distance between each Typical Price and that moving average over the same period.
- CCI: CCI = (TP - SMA of TP) / (0.015 x Mean Deviation).
The constant 0.015 was chosen by Lambert so that roughly 70% to 80% of CCI values fall between -100 and +100. You never need to compute this by hand: charting platforms and TradingSignal do it for you, but understanding the formula helps you interpret what the indicator is really telling you.
How to Read the CCI
The CCI is usually read around three key zones:
- Above +100: price is trading well above its average. This can signal an overbought market, or the start of a strong bullish trend.
- Below -100: price is trading well below its average. This can signal an oversold market, or the start of a strong bearish trend.
- Between -100 and +100: price is moving within its normal range, with no extreme momentum.
The zero line also matters: a CCI above 0 means price is above its average (bullish bias), while a CCI below 0 means it is below its average (bearish bias). Some traders use more extreme levels such as +200 and -200 to filter out noise in very volatile markets like crypto.
Popular CCI Trading Strategies
1. Overbought and Oversold Reversals
The classic mean-reversion approach is to watch for the CCI to move above +100 and then fall back below it (potential sell signal), or to drop below -100 and then rise back above it (potential buy signal). This works best in ranging markets where price oscillates between support and resistance.
2. Trend Breakout (Lambert's Original Method)
Lambert originally used the CCI to identify new trends: a move above +100 suggests the beginning of a strong uptrend, and a move below -100 suggests the beginning of a strong downtrend. In this approach, crossing +100 is a signal to buy, not to sell, and the position is held until the CCI falls back toward the zero line.
3. Zero Line Crossovers
A CCI crossing above 0 confirms that bullish momentum is taking over, while a cross below 0 confirms bearish momentum. Zero line crosses produce more signals than the +/-100 levels, so they are often combined with a trend filter.
4. CCI Divergence
- Bullish divergence: price makes a lower low, but the CCI makes a higher low. Selling pressure is weakening and a reversal to the upside may follow.
- Bearish divergence: price makes a higher high, but the CCI makes a lower high. Buying momentum is fading and a pullback may be coming.
Divergences are early warnings rather than entry signals on their own, so it is wise to wait for confirmation from price action or a CCI cross back through +/-100.
Best CCI Settings for Crypto
The default CCI length is 20 periods, which offers a good balance between responsiveness and reliability. Shorter lengths (such as 10 or 14) react faster and generate more signals, which can suit scalpers on 5m or 15m charts, but they also produce more false signals. Longer lengths (such as 50 or 100) smooth the indicator and are better suited for swing trading on 4h or daily charts.
The timeframe matters as much as the length: a CCI reading above +100 on the daily chart carries much more weight than the same reading on a 1-minute chart. Many traders check the higher timeframe trend first, then use the CCI on a lower timeframe to time their entries.
CCI vs RSI: What Is the Difference?
Both are momentum oscillators, but they work differently. The RSI is bounded between 0 and 100 and compares average gains to average losses. The CCI is unbounded and measures the distance of price from its average relative to normal volatility. Because it has no ceiling, the CCI can better reflect the strength of an extreme move, which makes it especially popular for spotting breakouts and new trends. Many traders use both together to confirm signals. If you are new to the RSI, read our RSI Indicator Explained guide.
Combining the CCI With Other Tools
- Trend indicators such as moving averages, the Supertrend or the ADX, to make sure you trade CCI signals in the direction of the main trend.
- Support and resistance levels, to confirm that an oversold or overbought CCI reading occurs at a meaningful price area.
- Volume, to validate breakouts: a CCI move above +100 backed by rising volume is more reliable.
- Candlestick patterns, such as a Doji or Shooting Star, to time entries when the CCI reaches an extreme.
Limitations of the CCI
- Because it is unbounded, there is no universal overbought or oversold level: what counts as extreme varies from one asset and timeframe to another.
- In strong trends, the CCI can stay above +100 or below -100 for a long time, so fading every extreme reading can be costly.
- Short lengths and low timeframes generate many false signals, especially in choppy crypto markets.
- Like every indicator derived from price, the CCI is lagging and should always be combined with risk management and other forms of confirmation.
Setting Up a CCI Alert on TradingSignal
Watching the CCI on several charts all day is exhausting. The good news is that it is very easy to create an alert based on the CCI indicator in the TradingSignal app, and let the app monitor the market for you. A CCI alert only requires a few simple fields:
- Value: the CCI level you want to watch, for example +100 for overbought or bullish breakouts, -100 for oversold or bearish breakouts, or 0 for zero line crossovers.
- Length: the number of periods used to calculate the CCI (20 is the classic setting).
- Condition: whether you want to be notified when the CCI crosses above or below your chosen value.
- Interval: the candle timeframe to calculate the CCI on, from 1-minute charts up to daily charts.
Pick your pair among 1500+ markets on Binance and KuCoin, fill in those fields, save your alert, and TradingSignal will send you a push notification or an email the moment the CCI meets your condition. No need to keep a chart open or calculate anything by hand: download the TradingSignal app and create your first CCI alert in seconds.